
UK Car Theft Statistics
Worried About Car Theft? Here Are The Facts
Quick Links
- Introduction
- What Is The Impact Of Car Theft On Drivers?
- Car Theft Statistics UK | Overview
- Car Theft By Area
- Car Theft By Area (Map)
- Car Theft By Area (List)
- The Most Stolen Cars
- The Least Stolen Cars
- Recovery Rates Of Stolen Cars
- Car Theft By Year
- Theft From Keyless Entry & Other Considerations
- Our Final Word
Introduction
Worried about car theft? Sadly, car theft has been on the rise for several years and is a growing concern for most drivers in the UK, so you’re not alone.
Here, we’re examining the numbers, using the Office Of National Statistics data to understand car theft throughout the UK, the hotspots, at risk vehicles and methods that thieves are applying. We’ve even put together an interactive map, so you can find crime data for your area quickly.
Hopefully, by understanding this, you’ll be better informed and prepared to protect your car. First, though, let’s take a look at some of the basics of car crime:
What Is The Impact Of Car Theft On Drivers?
Aside from the stress and hassle of having your car stolen and the subsequent dealings with police, there are other financial consequences to consider too.
It goes without saying that if your car is stolen, you’ll need to claim on your insurance. Unfortunately, even though you aren’t at fault (as you could be in an accident, for example), this will most likely affect your no-claims bonus and future premiums.
Your car will be classed a ‘total loss’ by your insurance company if it’s never recovered, offering you a ‘final settlement figure’ as a payout. However, if your car is in negative equity (where the finance owed is higher than the current market value) or the value is less than the cost of a replacement vehicle, you could be left out of pocket and financially liable.
Gap Insurance or Vehicle Replacement Cover should be a consideration, as this preventative measure can help protect you against any financial shortfall you may face if your car is stolen.
Car Theft Statistics UK | Overview
Between April 2023 and March 2024, there were 129159 vehicles stolen across the country, equating to 354 vehicles stolen per day, or one every four minutes.
Whilst this was lower than the previous year (with 130119 vehicle thefts reported) it does continue the trend of record-high figures, which have risen consistently since 2015.
As well as outright theft, drivers have reported a 2% increase in theft of parts such as bumpers, exhaust systems and catalytic converters from cars driven in part by the 35% increase in aftermarket parts.
Car Theft By Area (April 2023 to March 2024)
Use our interactive UK Car Theft Map to find car theft data for your area. Lighter red areas denote lower levels of car theft, with darker red areas denoting higher levels.
Alternatively, find data for a specific area, including number of car thefts and thefts per 1000 people using the list below.
Car Theft By Area Map
Car Theft By Area List
- Bedfordshire: Number of stolen vehicles: 642 | Car thefts per 1,000 people: 0.91
- Berkshire: Number of stolen vehicles: 800 | Car thefts per 1,000 people: 0.88
- Bristol: Number of stolen vehicles: 506 | Car thefts per 1,000 people: 1.09
- Buckinghamshire: Number of stolen vehicles: 765 | Car thefts per 1,000 people: 0.91
- Cambridgeshire: Number of stolen vehicles: 558 | Car thefts per 1,000 people: 0.65
- Cheshire: Number of stolen vehicles: 417 | Car thefts per 1,000 people: 0.39
- Cornwall: Number of stolen vehicles: 133 | Car thefts per 1,000 people: 0.23
- County Durham: Number of stolen vehicles: 330 | Car thefts per 1,000 people: 0.38
- Cumbria: Number of stolen vehicles: 84 | Car thefts per 1,000 people: 0.17
- Derbyshire: Number of stolen vehicles: 555 | Car thefts per 1,000 people: 0.53
- Devon: Number of stolen vehicles: 319 | Car thefts per 1,000 people: 0.27
- Dorset: Number of stolen vehicles: 346 | Car thefts per 1,000 people: 0.45
- East Sussex: Number of stolen vehicles: 342 | Car thefts per 1,000 people: 0.40
- East Yorkshire: Number of stolen vehicles: 279| Car thefts per 1,000 people: 0.46
- Essex: Number of stolen vehicles: 2,532 | Car thefts per 1,000 people: 1.38
- Gloucestershire: Number of stolen vehicles: 231 | Car thefts per 1,000 people: 0.25
- Greater London: Number of stolen vehicles: 14,106 | Car thefts per 1,000 people: 1.58
- Greater Manchester: Number of stolen vehicles: 2,706 | Car thefts per 1,000 people: 0.96
- Hampshire: Number of stolen vehicles: 959 | Car thefts per 1,000 people: 0.52
- Herefordshire: Number of stolen vehicles: 59 | Car thefts per 1,000 people: 0.31
- Hertfordshire: Number of stolen vehicles: 1,160 | Car thefts per 1,000 people: 0.98
- Isle of Wight: Number of stolen vehicles: 29 | Car thefts per 1,000 people: 0.20
- Kent: Number of stolen vehicles: 1,539 | Car thefts per 1,000 people: 0.83
- Lancashire: Number of stolen vehicles: 805 | Car thefts per 1,000 people: 0.54
- Leicestershire: Number of stolen vehicles: 865 | Car thefts per 1,000 people: 0.82
- Lincolnshire: Number of stolen vehicles: 435 | Car thefts per 1,000 people: 0.40
- Merseyside: Number of stolen vehicles: 592 | Car thefts per 1,000 people: 0.48
- Norfolk: Number of stolen vehicles: 166 | Car thefts per 1,000 people: 0.18
- North Yorkshire: Number of stolen vehicles: 346 | Car thefts per 1,000 people: 0.42
- Northamptonshire: Number of stolen vehicles: 384 | Car thefts per 1,000 people: 0.51
- Northumberland: Number of stolen vehicles: 84 | Car thefts per 1,000 people: 0.26
- Nottinghamshire: Number of stolen vehicles: 572| Car thefts per 1,000 people: 0.69
- Oxfordshire: Number of stolen vehicles: 310 | Car thefts per 1,000 people: 0.45
- Rutland: Number of stolen vehicles: 13 | Car thefts per 1,000 people: 0.33
- Scotland: Number of stolen vehicles: 1,305| Car thefts per 1,000 people: 0.24
- Shropshire: Number of stolen vehicles: 295 | Car thefts per 1,000 people: 0.59
- Somerset: Number of stolen vehicles: 288 | Car thefts per 1,000 people: 0.30
- South Yorkshire: Number of stolen vehicles: 1,979 | Car thefts per 1,000 people: 1.41
- Staffordshire: Number of stolen vehicles: 970 | Car thefts per 1,000 people: 0.86
- Suffolk: Number of stolen vehicles: 188 | Car thefts per 1,000 people: 0.25
- Surrey: Number of stolen vehicles: 619 | Car thefts per 1,000 people: 0.52
- Tyne and Wear: Number of stolen vehicles: 493 | Car thefts per 1,000 people: 0.43
- Wales: Number of stolen vehicles: 1,461 | Car thefts per 1,000 people: 0.46
- Warwickshire: Number of stolen vehicles: 564 | Car thefts per 1,000 people: 0.99
- West Midlands: Number of stolen vehicles: 7,694 | Car thefts per 1,000 people: 2.64
- West Sussex: Number of stolen vehicles: 254 | Car thefts per 1,000 people: 0.30
- West Yorkshire: Number of stolen vehicles: 2,378 | Car thefts per 1,000 people: 1.02
- Wiltshire: Number of stolen vehicles: 538 | Car thefts per 1,000 people: 0.75
- Worcestershire: Number of stolen vehicles: 505 | Car thefts per 1,000 people: 0.85
- Northern Ireland: Number of stolen vehicles: 213 | Car thefts per 1,000 people: 0.11
Source: Office For National Statistics
Areas With The Highest Car Theft Rates
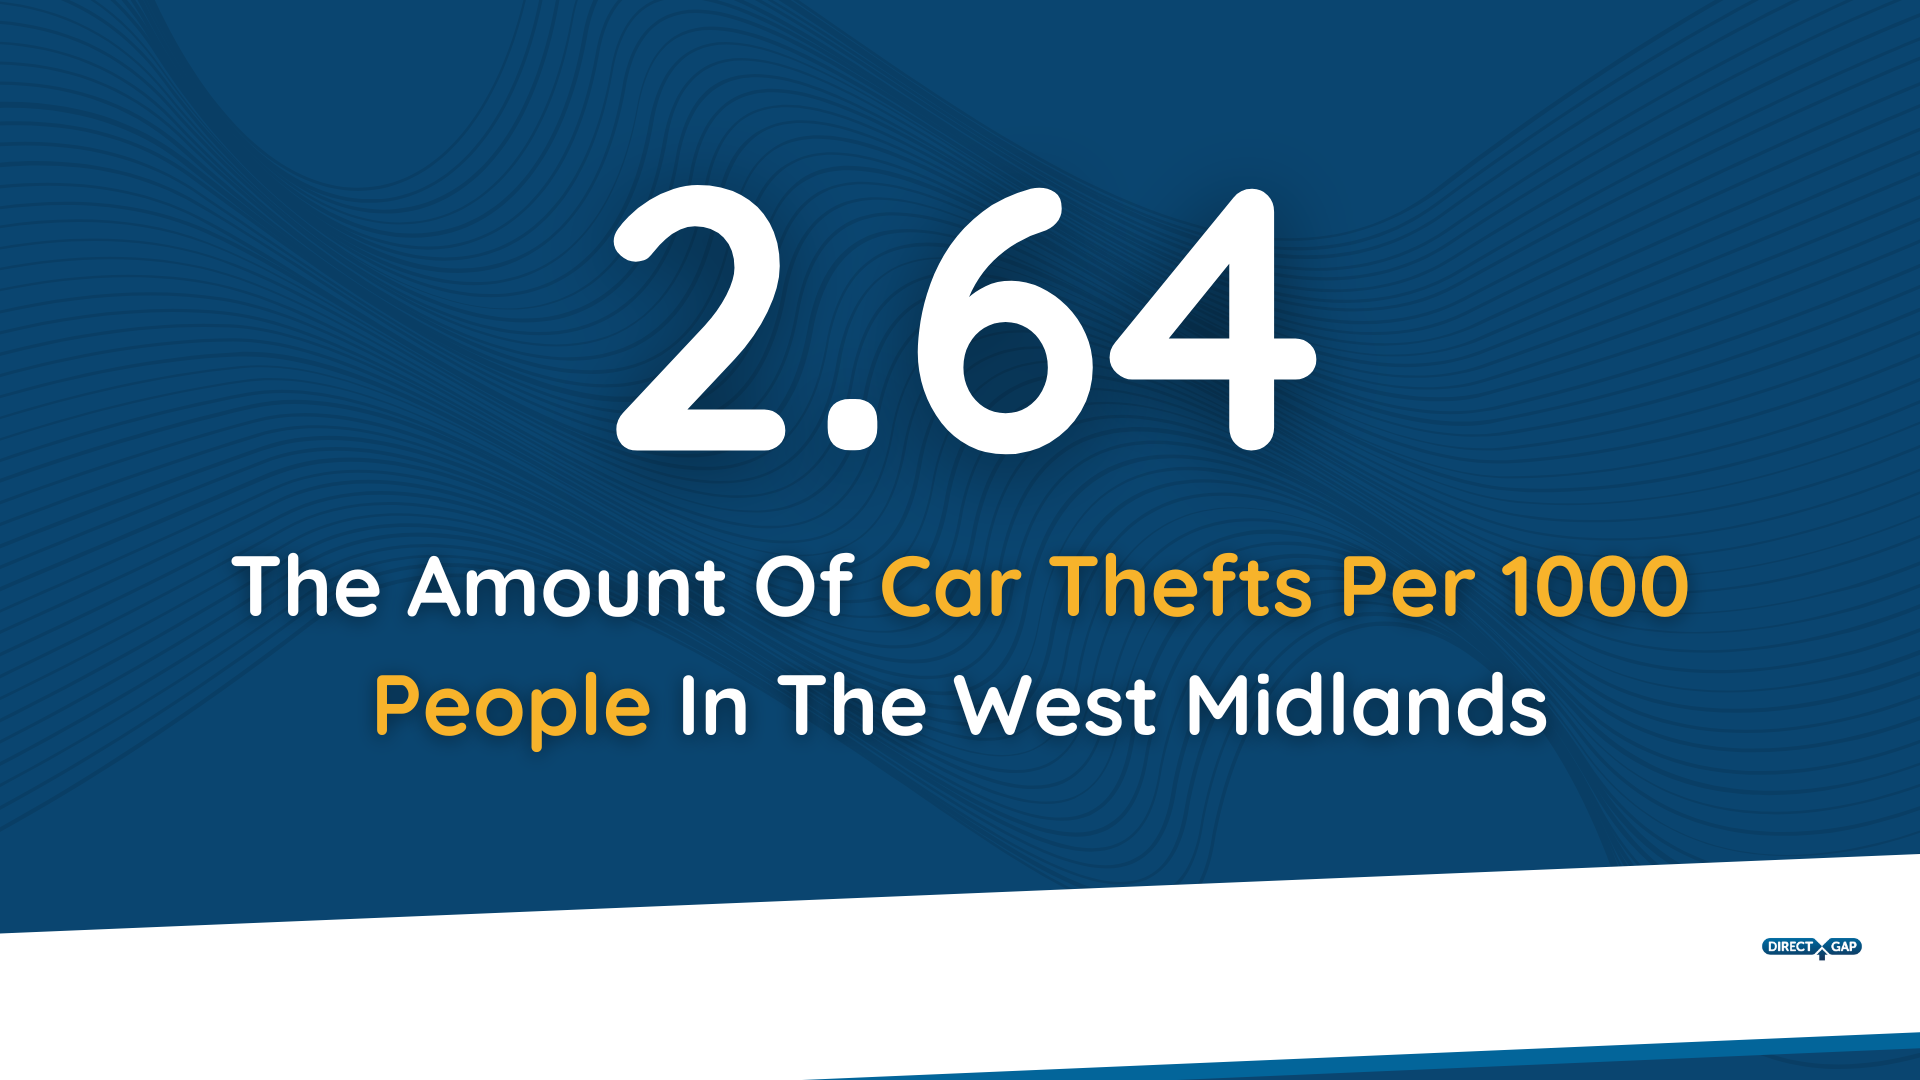
Based on the number of thefts per 1000 people, the West Midlands is by far the worst area of the UK for stolen cars, with 2.64 reported for every 1000 people.
Following behind in second and third place are Greater London with 1.58 thefts per 1000 people and South Yorkshire with 1.41 thefts per 1000 people, respectively.
Looking at the total number of stolen cars, Greater London tops the list with 14106 reported between April 2023 and March 2024.
Areas With The Lowest Car Theft Rates
Northern Ireland has the lowest outright car theft, with only 0.11 reported per 1000 people. Cumbria is second lowest with 0.17 reported car thefts whilst Norfolk is third lowest with 0.18 reports.
Scotland also has low car theft numbers, with just 0.24 being reported per 1000 people.
The Most Stolen Cars
Certain car models are more frequently targeted by thieves. In 2024, the top stolen vehicles in the UK were:
- Ford Fiesta: 4,446 thefts
- Volkswagen Golf: 1,731 thefts
- Ford Focus: 1,700 thefts
- BMW 3 Series: 1,371 thefts
- Toyota RAV4: 1,260 thefts
- Mercedes-Benz C-Class: 1,123 thefts
- Range Rover Evoque: 1,087 thefts
- Nissan Juke: 1,027 thefts
- Vauxhall Corsa: 870 thefts
- Range Rover Sport: 867 thefts
The Ford Fiesta's prominence on this list is partly due to its popularity and the high number of units on the road. Additionally, its parts are in demand, making it a frequent target for thieves.
As well as this, with the Fiesta being discontinued, it could be the case that more are targeted for parts, which is explored in more detail in our blog: Car Theft Is On The Rise In The UK.
The Least Stolen Cars
While comprehensive data on the least stolen cars is less readily available, certain models consistently report lower theft rates.
Vehicles equipped with advanced security features, less common models, or those with lower resale values tend to be less attractive to thieves.
Owners should research specific models and their associated theft rates when considering a purchase.
Read More: Can Gap Insurance Help If Your Car Is Stolen?
Recovery Rates of Stolen Cars
According to Claims Management & Adjusting (CMA), which is part of the Quest Gates Group, just under 41% of stolen cars in the UK were recovered in 2023, which rose slightly in 2024, where 42.9% were recovered (with 20.27% recovered within 7 days).
Conversely, this means that 57.1%, almost 2 out of every 3 cars stolen are not recovered and presumably declared a total loss by insurance companies.
Car Theft By Year
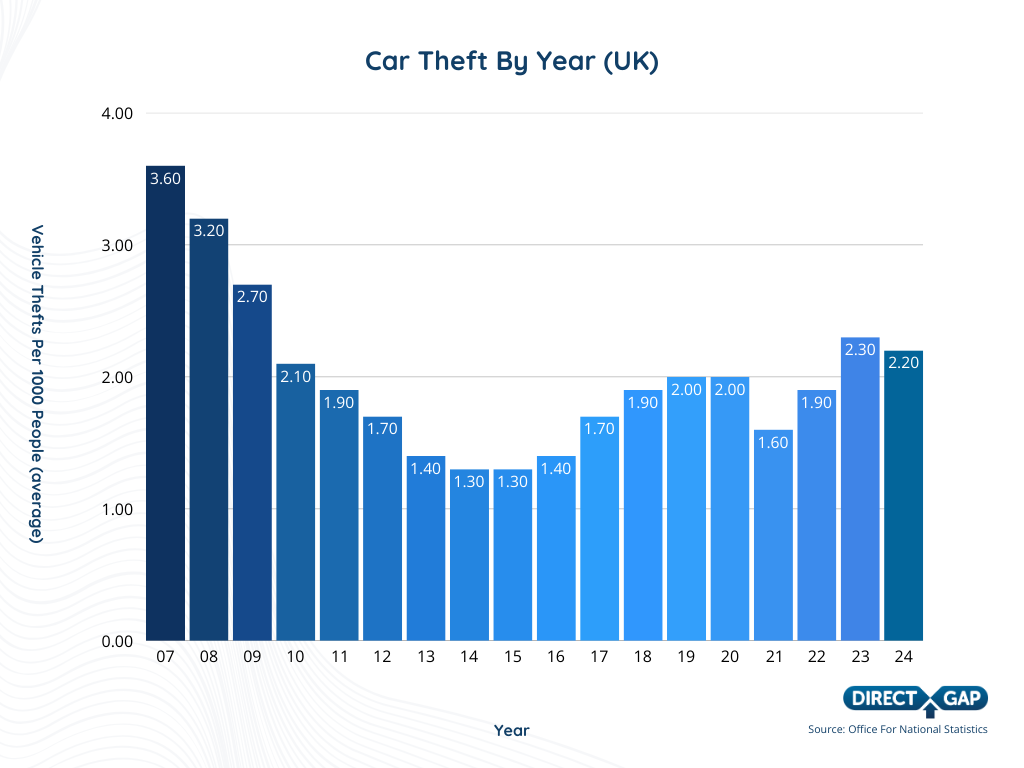
Which Year Had the Most Car Theft?
The UK experienced its highest vehicle theft rates in the early 1990s; in 1992, approximately 620,000 vehicle thefts were reported.
Which Year Had the Lowest Car Theft?
The lowest vehicle theft rates in recent history were recorded around 2014 and 2015, with approximately 1.3 thefts per 1,000 people.
However, this rate has seen an upward trend in subsequent years, reaching 2.2 thefts per 1,000 people in 2024, a 67% increase from the 2014-2015 figures.
Theft from 'Smart Keys (Keyless Entry)' and Other Considerations
Theft From ‘Smart Keys (Keyless Entry) Rises
The advent of keyless entry systems has introduced new vulnerabilities.
Thieves have developed techniques such as relay attacks to exploit these systems, allowing them to unlock and start vehicles without the physical key. This method has contributed to the rise in thefts of models like the Nissan Juke, which saw a 61.5% increase in thefts from 2023 to 2024.
To mitigate the risk of keyless car theft:
- Store Key Fobs Securely: Keep key fobs in signal-blocking pouches to prevent relay attacks.
- Use Physical Barriers: Employ steering wheel locks or wheel clamps as visible deterrents.
- Update Software: Regularly update your vehicle's software to benefit from the latest security patches.
- Install Tracking Devices: These can aid in the recovery of your vehicle if stolen.
Stolen To Order Cars
Whilst there's yet to be much in the way of numerical data for targeted car thefts, known as ‘stolen to order’ theft, anecdotal reports are shocking.
Seasoned car thieves, when interviewed, have stated that they’re often ‘given a list of five to six cars at a time’, with some saying they can be stealing between 60-90 cars every week.
Stolen to order car theft is a particular problem in the high-end car market, where thieves will target a specific make or model to act as a donor car for another, which has been purchased at a lower rate thanks to damage or the need for repairs.
Our Final Word
While the UK has seen fluctuations in vehicle theft rates over the years, the issue remains pertinent.
Awareness of current trends, understanding which vehicles are most at risk, and implementing robust security measures are crucial steps in protecting your vehicle.
Staying informed and proactive can significantly reduce the likelihood of falling victim to car theft, especially as criminals become more savvy, with key theft on the rise.
We hope you’ve found this guide informative and helpful. If you have, please share it with your network and let us spread the understanding of car theft and its implications.
As always, be sure to contact Luke using social media if you have any questions; he’s always happy to help.
Pin It!


Luke Sanderson
Luke is our resident copywriter, combining plenty of automotive experience, particularly in car sales with a commitment to well-researched, extensive writing. He draws on his own experiences, as well as quizzing the entire team at Direct Gap to ensure the blogs and articles you read are worthwhile, valuable and accurate. Got a question for Luke? Drop us a DM on social media and he'll be happy to help.